Answer
The GFI WebMonitor logs can be gathered using a script or manually.To gather the logs using the script:
- Download the script from http://ftp.gfisoftware.com/temp/PSG/WM/Temp/WebMonLG.zip
- Wait for the the ZIP file to finish downloading:
- Right-click the ZIP file, and then click Properties;
- In the General tab, click Unblock;
- Unpack the ZIP file;
- Right-click the WebMonLG.ps1 file and select 'Run in Powershell'
NOTE: If you get a black flash and the script does not run the Execution Policy is set to block scripts.
- Open Powershell (Start > Programs > Accessories > Windows Powershell > Powershell)
- Run the command 'Get-ExecutionPolicy' without quotes to get the current Execution Policy
- Run the command 'Set-ExecutionPolicy Unrestricted' without quotes to allow the script to run
- Rick click the WebMonLG.ps1 file and select "Run in Powershell"
- Once the script is finished, remember to run "Set-ExecutionPolicy (previous policy)" without quotes or parentesis to reset it.
To run this script manually:
- Open Powershell (Start > Programs > Accessories > Windows Powershell > Powershell)
- Browse to the directory you saved the file.
- Run the command '.\WebMonLG' without quotes to run the script.
GFI WebMonitor will be using .etl files to log the activity generated by the Proxy filters. To generate these files use Microsoft Event Viewer and Performance Monitor.
NOTE: Complete the normal Troubleshooter steps from the link at the bottom of this page.
Microsoft Windows EventViewer
- Open Event Viewer (Start > Run > eventvwr.msc)
- Open the menu View and select the option “Show Analytic and DebugLogs”.
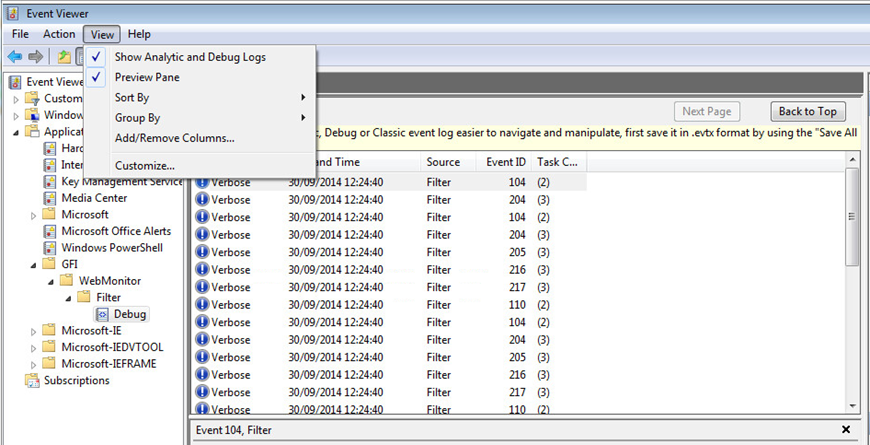
- Expand the “Application and Services Logs” node and navigate to GFI > WebMonitor > Filter > Debug

- On the Debug value right-click and select the option "Enable Log"
- Confirm with OK to proceed
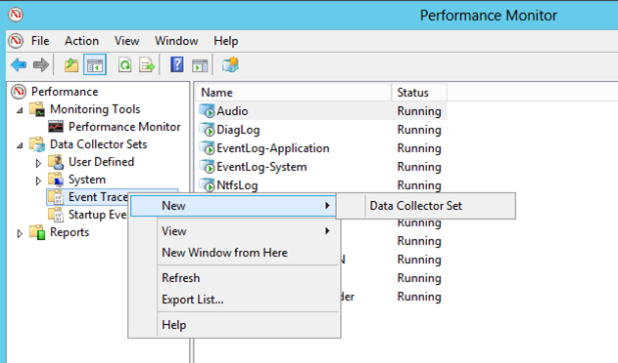
- Open Performance Monitor (Start > Run > Perfmon)
- Expand the Data Collector Sets node
- Right-click the folder Event Trace Session > New > Data Collector Set
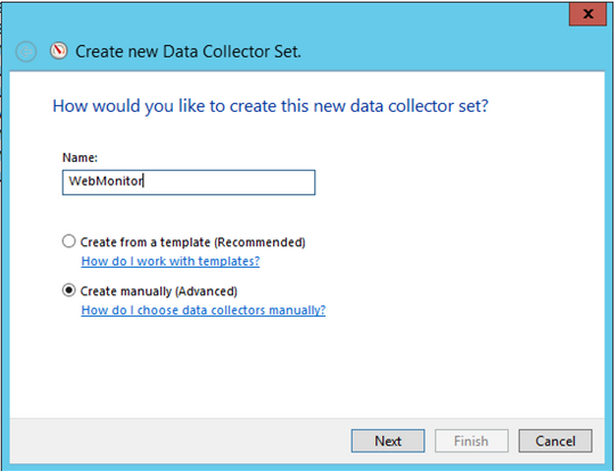
- Rename the Data Collector Set with a custom name. For example, "WebMonitor" and select the option create manually (advanced).
- In the next dialog screen, please specify the Event Trace Provider for the Data Collector Set:
- Click Add and select the value GFI-Webmonitor-Filter from the drop-down list
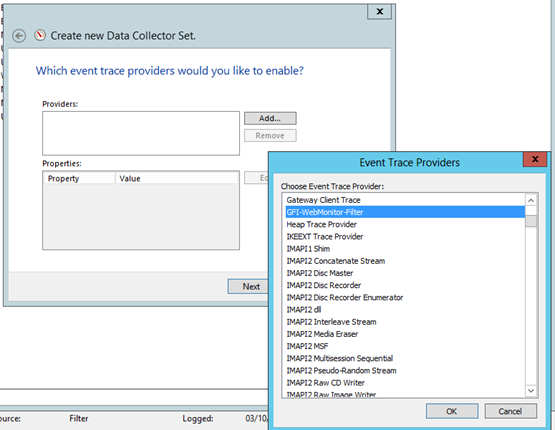
- Click OK
- Click Edit and specify how much detail of information is required for troubleshooting.
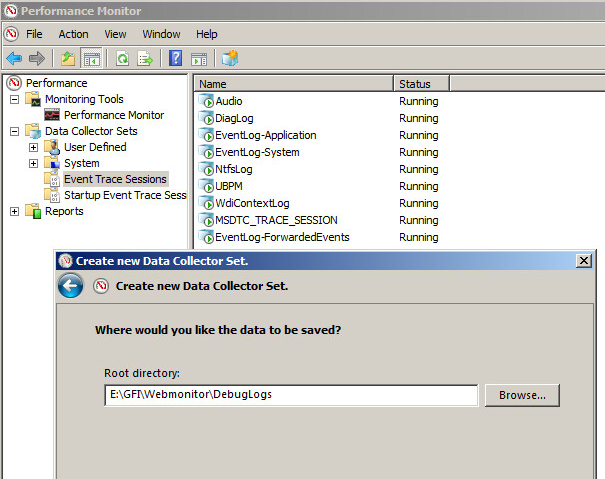
- In the next dialog screen, select the Root Directory where debug log files should be created. By default the value …\GFI\WebMonitor\DebugLogs is selected.
- Save and Close the dialog screen. You should now be able to set the new Data Collector Set at the top of the list.
- Select your Data Set Collector > Right-click Properties
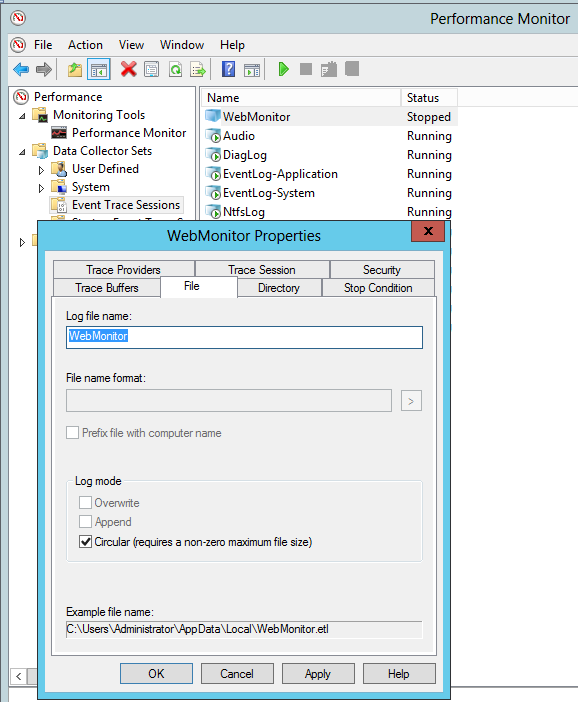
- Under the Stop Condition specify the maximum size of the log files created. Set the file size to 25 MB.
- Click Apply and OK.
- In the main Performance Monitor menu bar click the green start icon to start the capturing the process and reproduce the issue.
- Stop the capture process when the issue has been reproduced.
Please follow the instructions in the article below
Priyanka Bhotika
Comments